Two new metrics for newsletter creators in LinkedIn app has been added – the first one is email sends and other is email open rates which are now available through analytics page which provides more ways for measuring performance of communication sent.
So people who are not aware about these terms – Email sends refers to the number of subscribers which have received an email for this article whereas Email Open Rate refers to the % of subscribers who have opened the email sent for the article where the number is an estimate and might not be precise.
These metrics would help LinkedIn newsletter creators target and optimize their approaches. It will be a welcome addition to the existing data points. Before being launched, it was not clear how much readers would be relying on email versus in app notifications for accessing LinkedIn Newsletters. People have been questioning effectiveness of LinkedIn for newsletter distribution. This limitation was apparent while comparing LinkedIn to dedicated newsletter services.
These email stats would be helping publishers who are using multiple channels for conducting direct comparisons. It gives sponsors and advertisers greater transparency into whether branded content is reaching the inbox or not.
Despite this, a number of features still remain on the wish list of people. LinkedIn does not share email addresses of subscribers with newsletter authors and restricts their ability to manage subscriber relationship or move into broader email marketing systems.
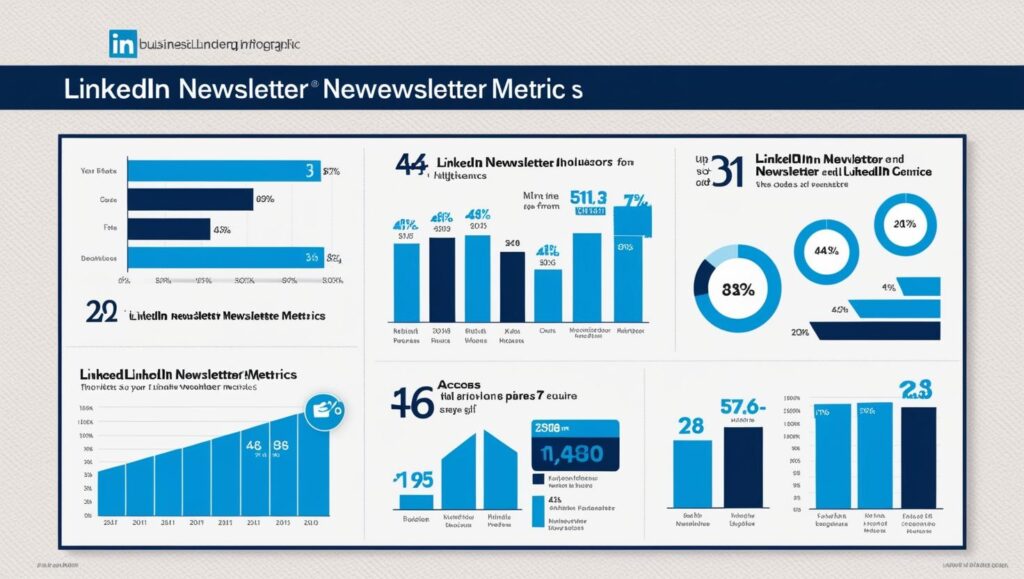
The metrics shows the total impressions, engagements and article views which the newsletter editions got over the date range selected. Analytics statistics are available for newsletter editions which have been posted in the last two years.
It shows the impressions which is the number of times your newsletter editions get displayed onscreen within the date range selected. The engagement received within the selected date range on the posts contains your newsletter edition which includes comments, reactions and shares.
You also get to see the article views where the number of times a member clicked on one of your newsletter editions to view it either on the article page or within newsletter email within the selected date range. Article views from organizations do not get included.
Under Article Views and New Subscribers, the percentage under these numbers represents the change rate or article views or new subscribers over the selected date range expressed as % of that number for the previous period. In case you received fifteen article views for the past seven days and ten article views for the seven days before that and you would see a 50% increase over the past seven days.
LinkedIn newsletters continue to gain traction with the platform reported last July that newsletters witnessed 47% increase in engagement over the preceding year whereas there are now more than 184,000 newsletters getting published in the app.
It will be presenting new opportunities for branding and professional outreach whereas you can now also pay for promoting newsletter or sponsoring a creator’s LinkedIn newsletter send. These additional data points lead to more strategy and planning and adds to LinkedIn’s existing data points which also includes insights into engagements, impressions and subscriber demographics.
Metrics are really important nowadays and these are considered the heart of any project as it gives clear picture of the marketing efforts and helps to plan and strategize marketing efforts for present and tomorrow.
This is really a great step taken by LinkedIn as nowadays you cannot survive without data and you need a number of metrics to stay ahead in the digital sphere which is surrounded by intense competition. So go ahead and make the most of this feature from LinkedIn.